The visual management solution dedicated to animate and motivate the operational teams, to promote performance and response to business issues, to pilot and have a shared vision in real time of the different activities according to the operational context, to relay general or specific type of communication.
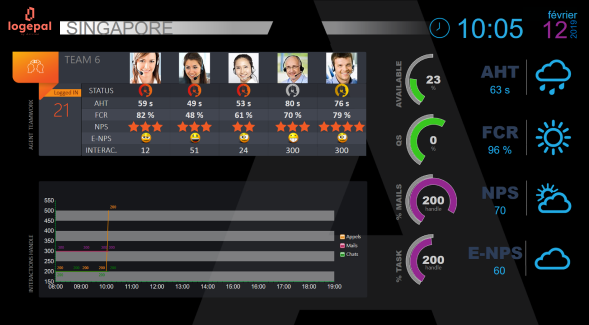
Wallboard display on TV OR Agent/Supervisor desktop dashboards OR Multimedia wallboard for internal and external communication.
Based on indicators defined and on a threshold defined. Logepal can sent a push mobile notification or a push mailing or even display a scrolling message on screen. Manager can also scheduled messages to display on screen for the coming week.
Animate and challenge your teams graphically in a fun atmosphere.
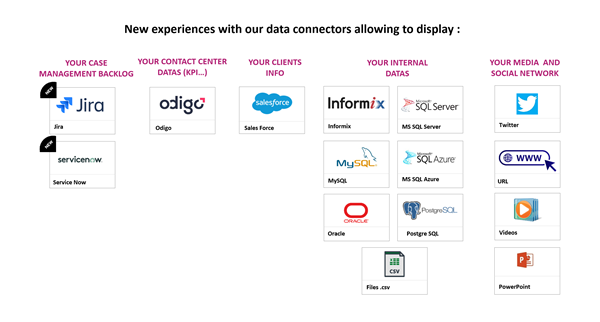
Experiences with Logepal data connectors allowing to display the health of its application assets (Jira, ServiceNow), Client information (Salesforce), Internal data (SqlServer, Oracle, Postgre, Csv file…), Odigo contact center datas (Kpi…).
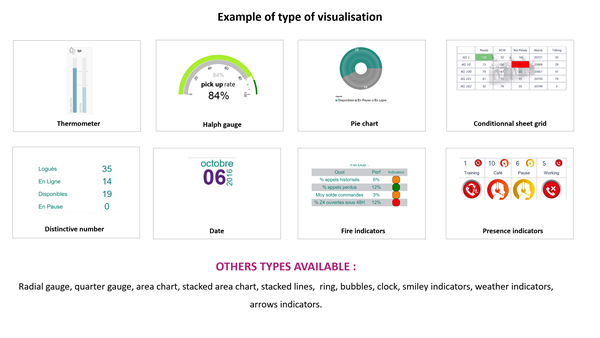
Type of visualisation are as followed : Thermometer, Half gauge, Pie chart, Conditionnal sheet grid, Distinctive number, Fire indicators, Presence indicators, Radial gauge, Barchart, Linechart, Stacked area chart, Donuts, bubbles …
Logepal is availabe on Google play and App Store.
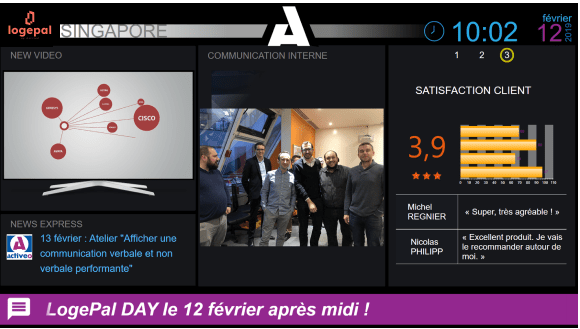
You can create several pages to display different type of information related to contact center activity, internal communication. Pages can be scheduled according to the context. Components used : Videos, images, integrated timeline within a page
Our connector with mutliple data source gives a 350° view of your contact center activities.
All type of visualisation can be customised with the graphic chart of the organisation. Two different data source into one line chart can be displayed (for example : forecast and realised datas)